VANTAGE CORE EXPLORATION SOFTWARE

Your exploration program,
live and legible.

The data your team already collects — collars, surveys, logs and assays — as an interactive map, a three-dimensional model and reports you can hand to a board. No migration, no re-keying, no specialist software to install.

WHY IT EXISTS THE BOTTLENECK

A drilling program generates more information than it can circulate.

Collars, depths, orientations, lithology, assays — scattered across spreadsheets, emails, field notebooks and specialist software only a few people can open. Decisions wait on whoever can assemble the latest version. Vantage Core removes that step: it reads the master data live and presents the same program as a map, a model and a report, current at every moment.

01

Your team logs

Exactly as they do now — the sheet, the software, the format they already use.

02

Vantage Core reads

Live, direct from the source. Nothing to import, nothing to re-key.

03

Everyone sees

Map, 3D, table and reports — one dataset, always the current state.

CAPABILITIES ACROSS THE PROGRAM

Everything the program needs, in one place.

01

Your data, as it is

The platform bends to your workflow, not the other way around — and every hole keeps its full history.

WHAT YOU ALREADY HAVE
Excel · Google Sheets
Contractor emails & reports
Downhole surveys
Other exploration software
VANTAGE CORE Reads it where it lives No import. No re-keying.
WHAT EVERYONE SEES
Program map
3D model
Long section
Reports & exports
01

Live Data Sync

Your spreadsheet, already an app.

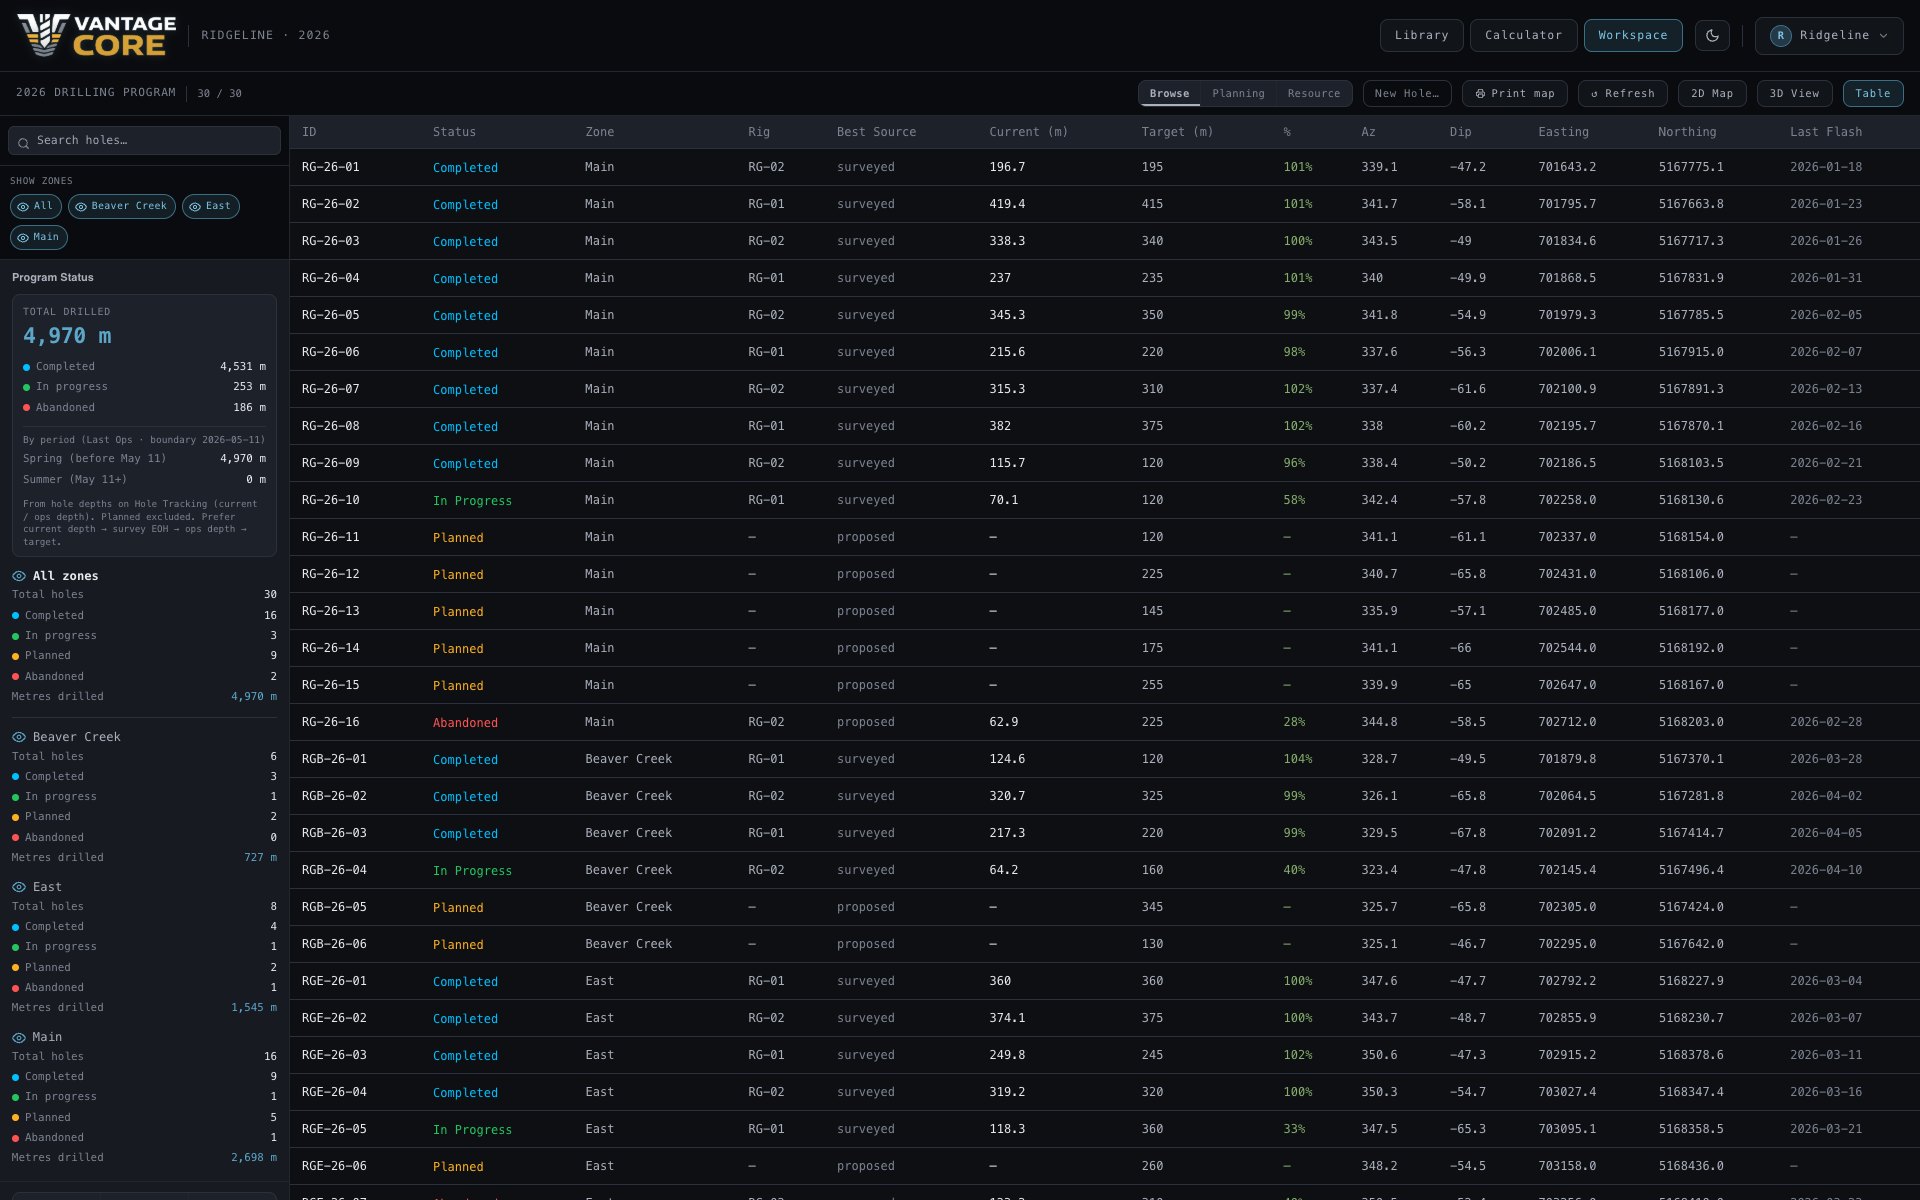
Vantage Core reads the file your team already keeps — Excel, Google Sheets, whatever you log in — and it doesn't need reformatting first. Odd column order, headers that only make sense to your crew, a layout that grew over three seasons: we map it to your program during setup, then it runs. Drilling returns and downhole surveys feed in the same way — if the contractor sends them digitally, in an email or a report, Vantage Core takes it from there and nobody re-keys anything. Run it one-way to keep your sheet untouchable, or two-way to write results back.
02

Proposed · Actual · Surveyed

Three versions of every hole. One you can trust.

Every hole carries its planned collar, its as-drilled position, and its downhole survey side by side. Vantage Core automatically displays the most reliable version available, so you're never staring at a plan line wondering whether the rig actually went there. Switch layers any time to see exactly how far reality drifted from the plan.

One dataset behind every view — so the map, the model and the report can't disagree.

02

Seeing the program

Where every hole is, how it sits in the ground, and what the shape of the deposit is telling you.

One program, four ways to read it
03

Program Map

The whole campaign at a glance.

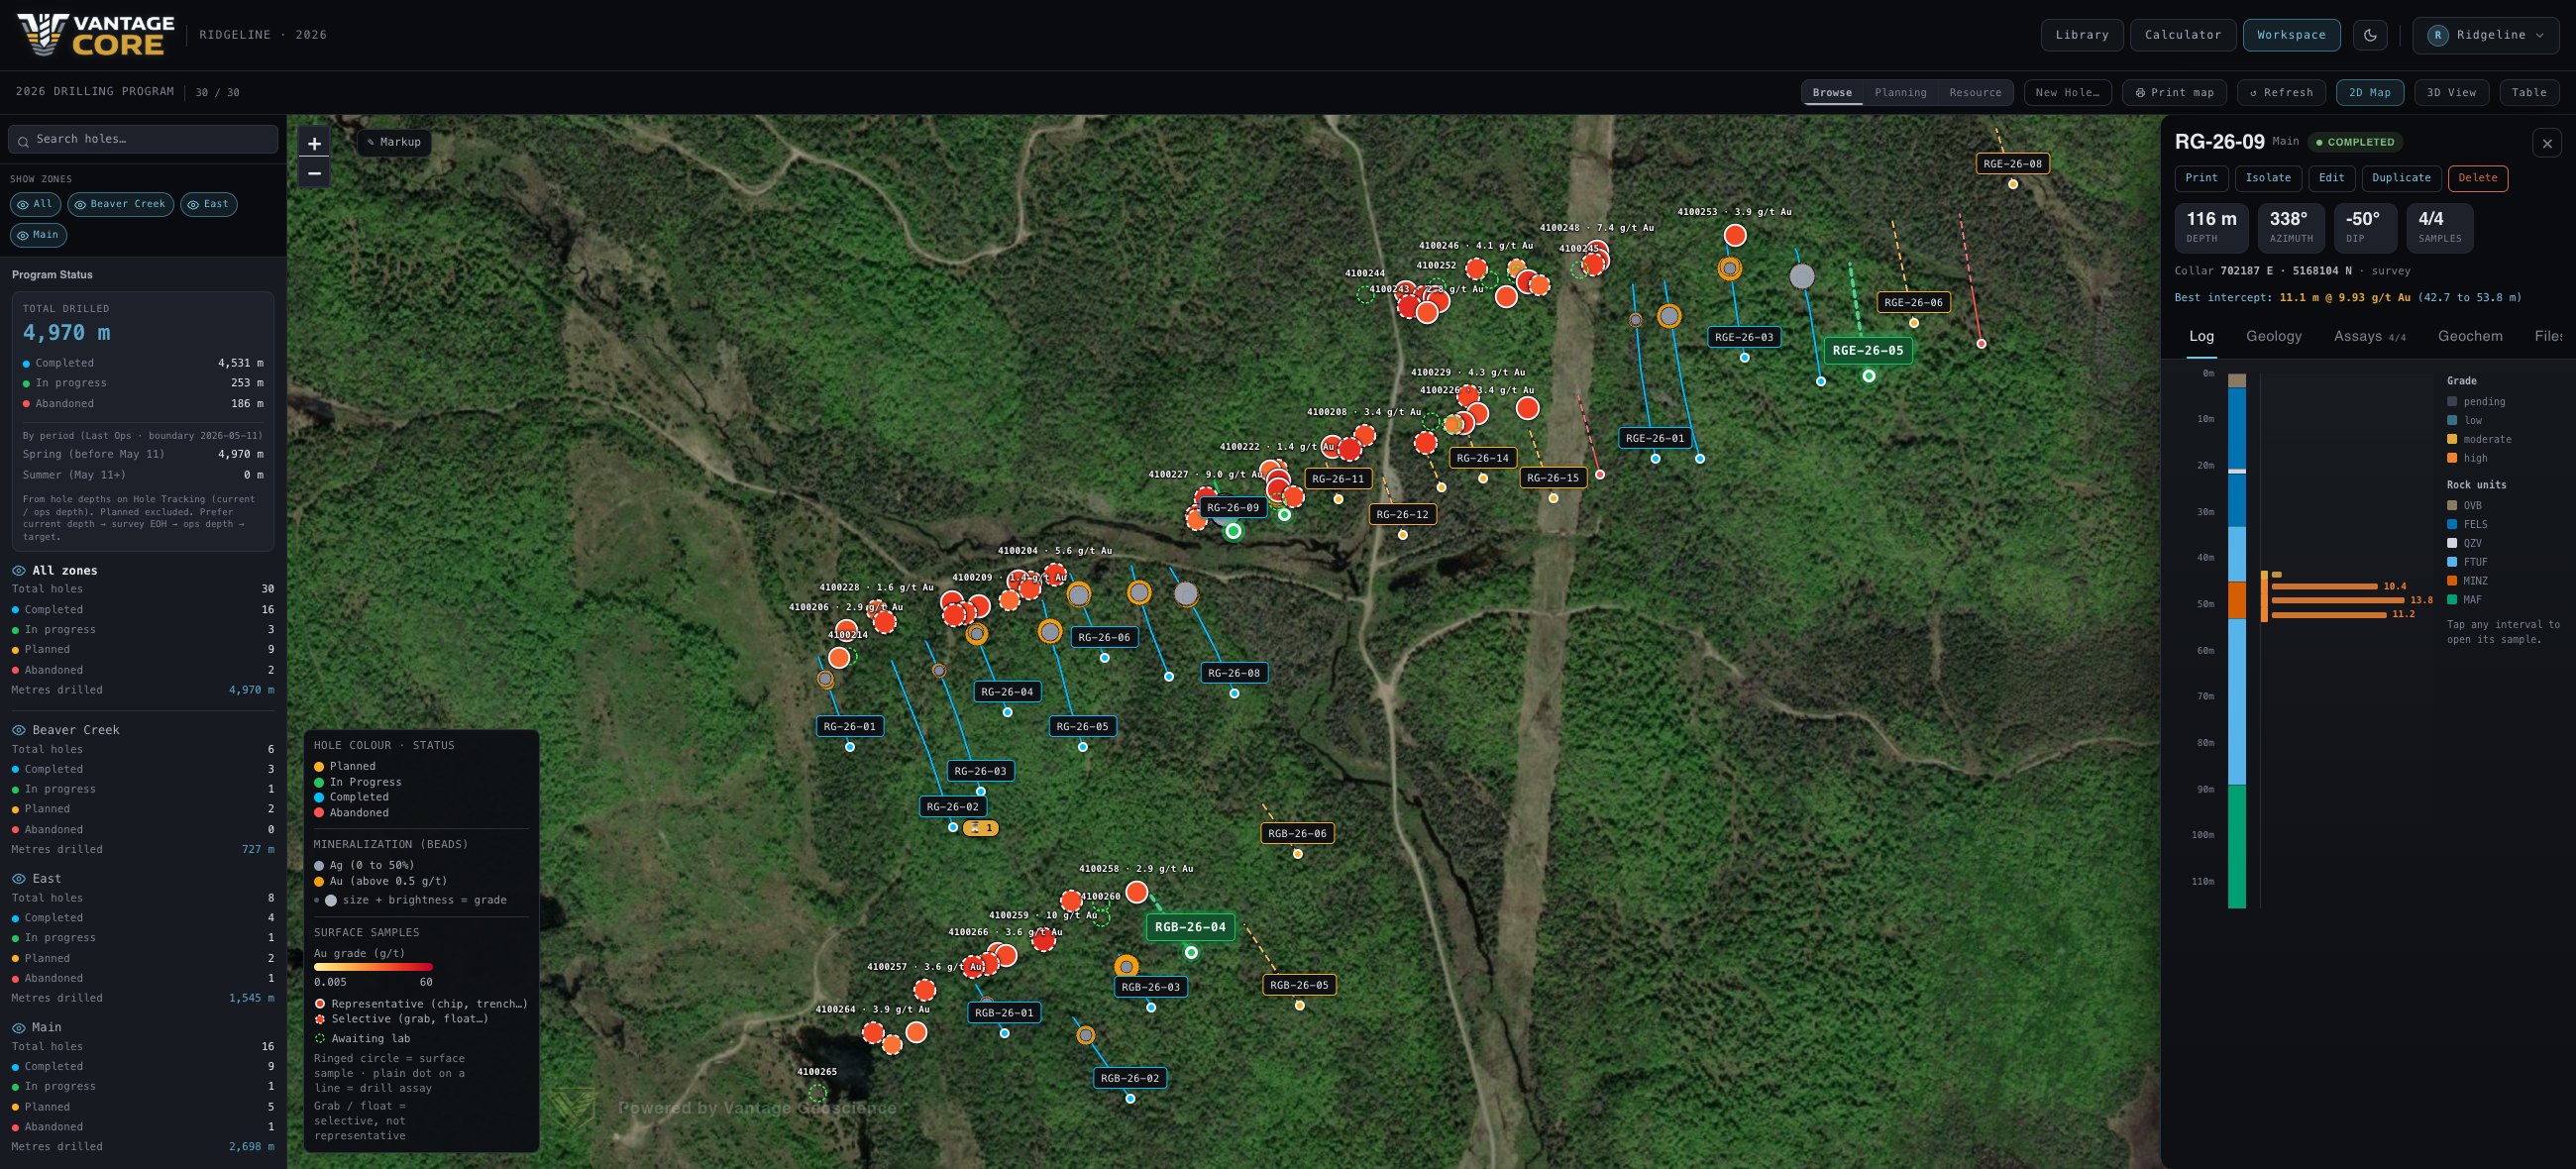
Every collar, colour-coded by status and filterable by zone, year and stage — with surface samples, annotations and your claim boundaries on the same canvas. Satellite, topo or standard basemaps, and your own ground as GeoJSON, KML or GPX. Arrange it the way you want it, and that's exactly what prints.

04

3D Terrain View

Drill holes in the real ground.

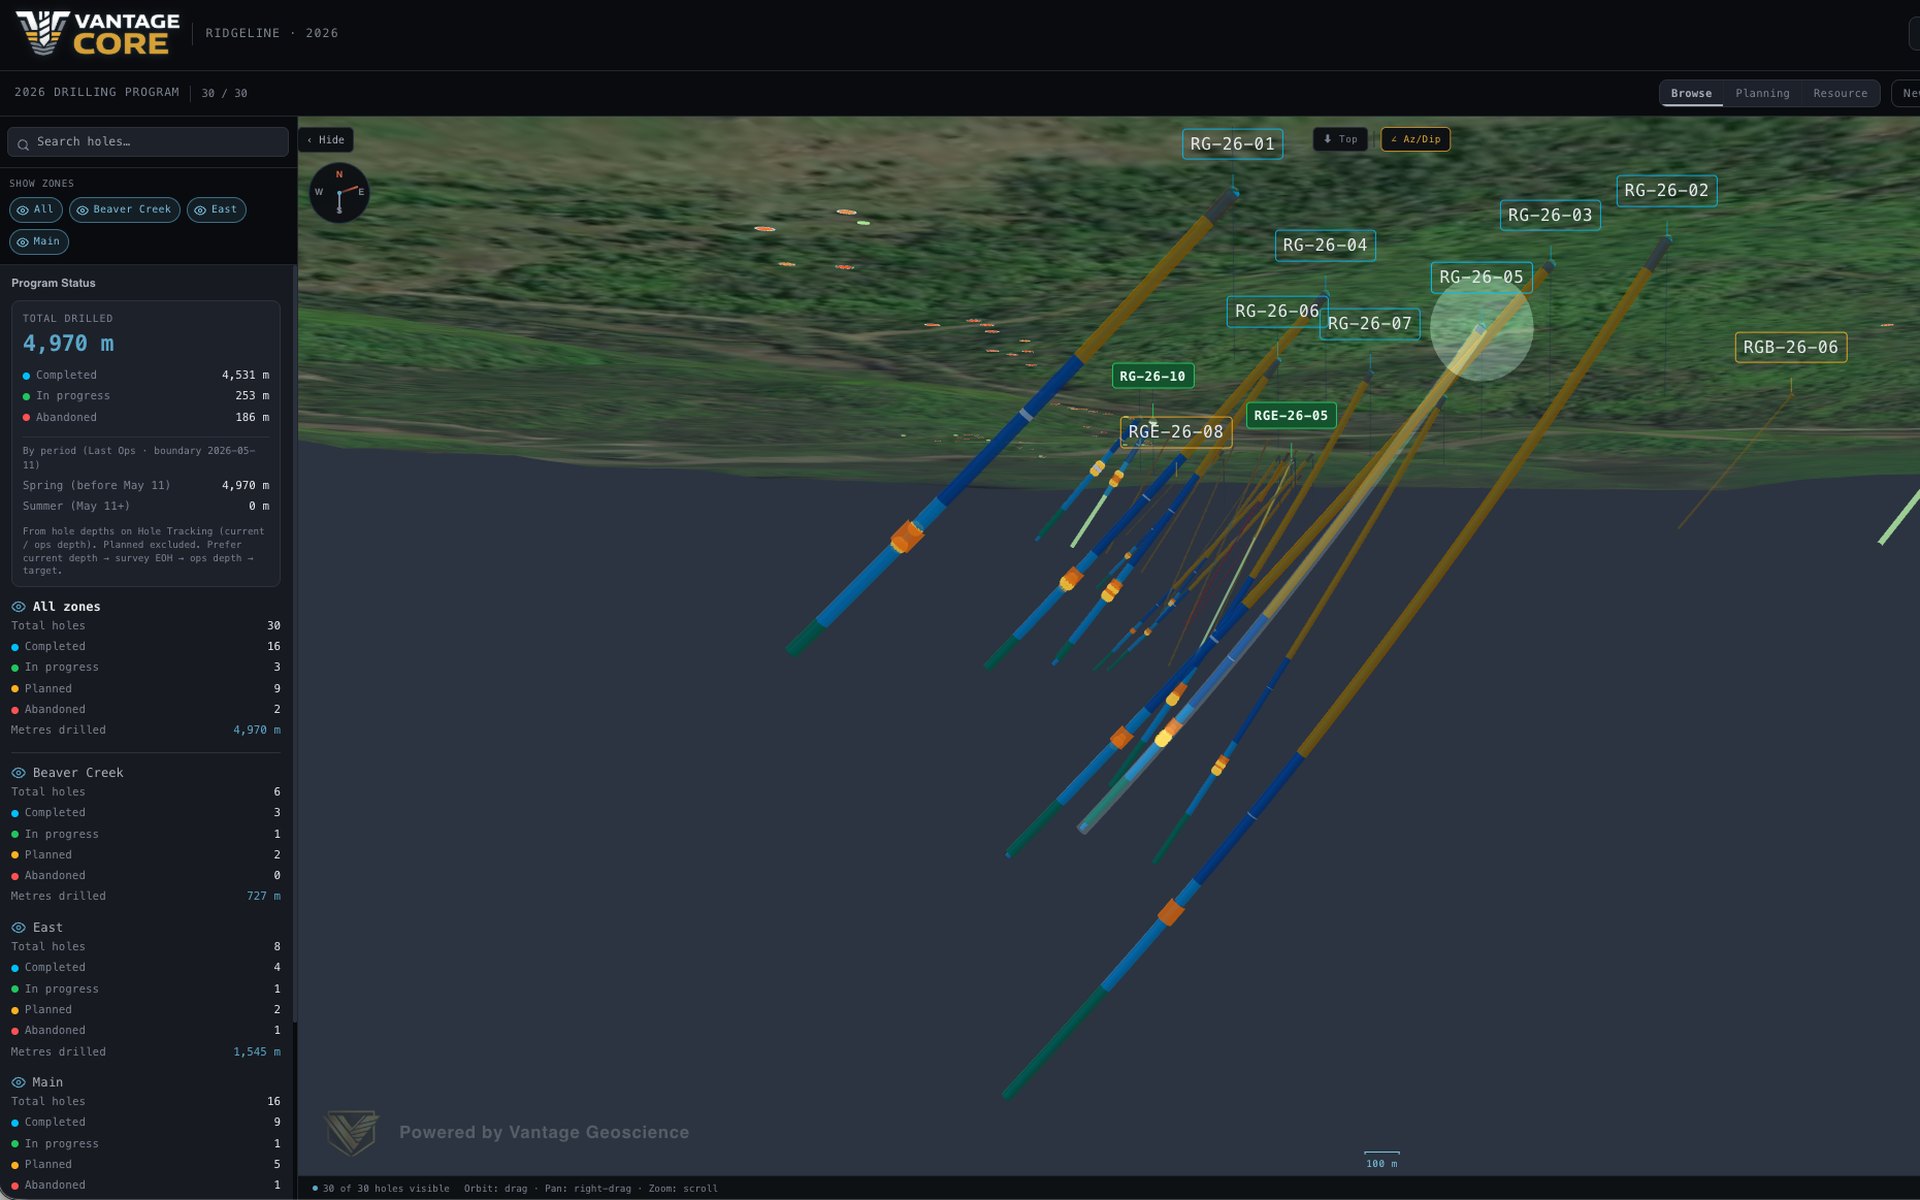
Fly through your project on a model of the actual site — a recently flown survey draped over it if you have one, satellite imagery if you don't — with every trace at true azimuth, dip and depth. Hover any hole to pull its log, depths and results without leaving the view.

05

Long Section

See the vein, not the holes.

A projected section that flattens your program onto the plane of the deposit, with grade-coloured intercepts in position. The fastest way to judge continuity between holes and spot where the zone is opening up — or closing off.

03

Reading the results

The same assays, in the form that actually tells you something.

IN A SPREADSHEET
HOLEFROMTOAu g/t
DDH-05118.0121.20.4
DDH-05121.2124.65.6
DDH-05124.6130.44.1
DDH-02146.2149.80.2
DDH-02149.8155.04.9
DDH-04201.5206.01.1
DDH-04206.0212.33.4
Rows. Correct, and unreadable at a glance.
IN SPACE
The same numbers, where they happened.
06

Grade Along the Hole

Assays where they belong — downhole.

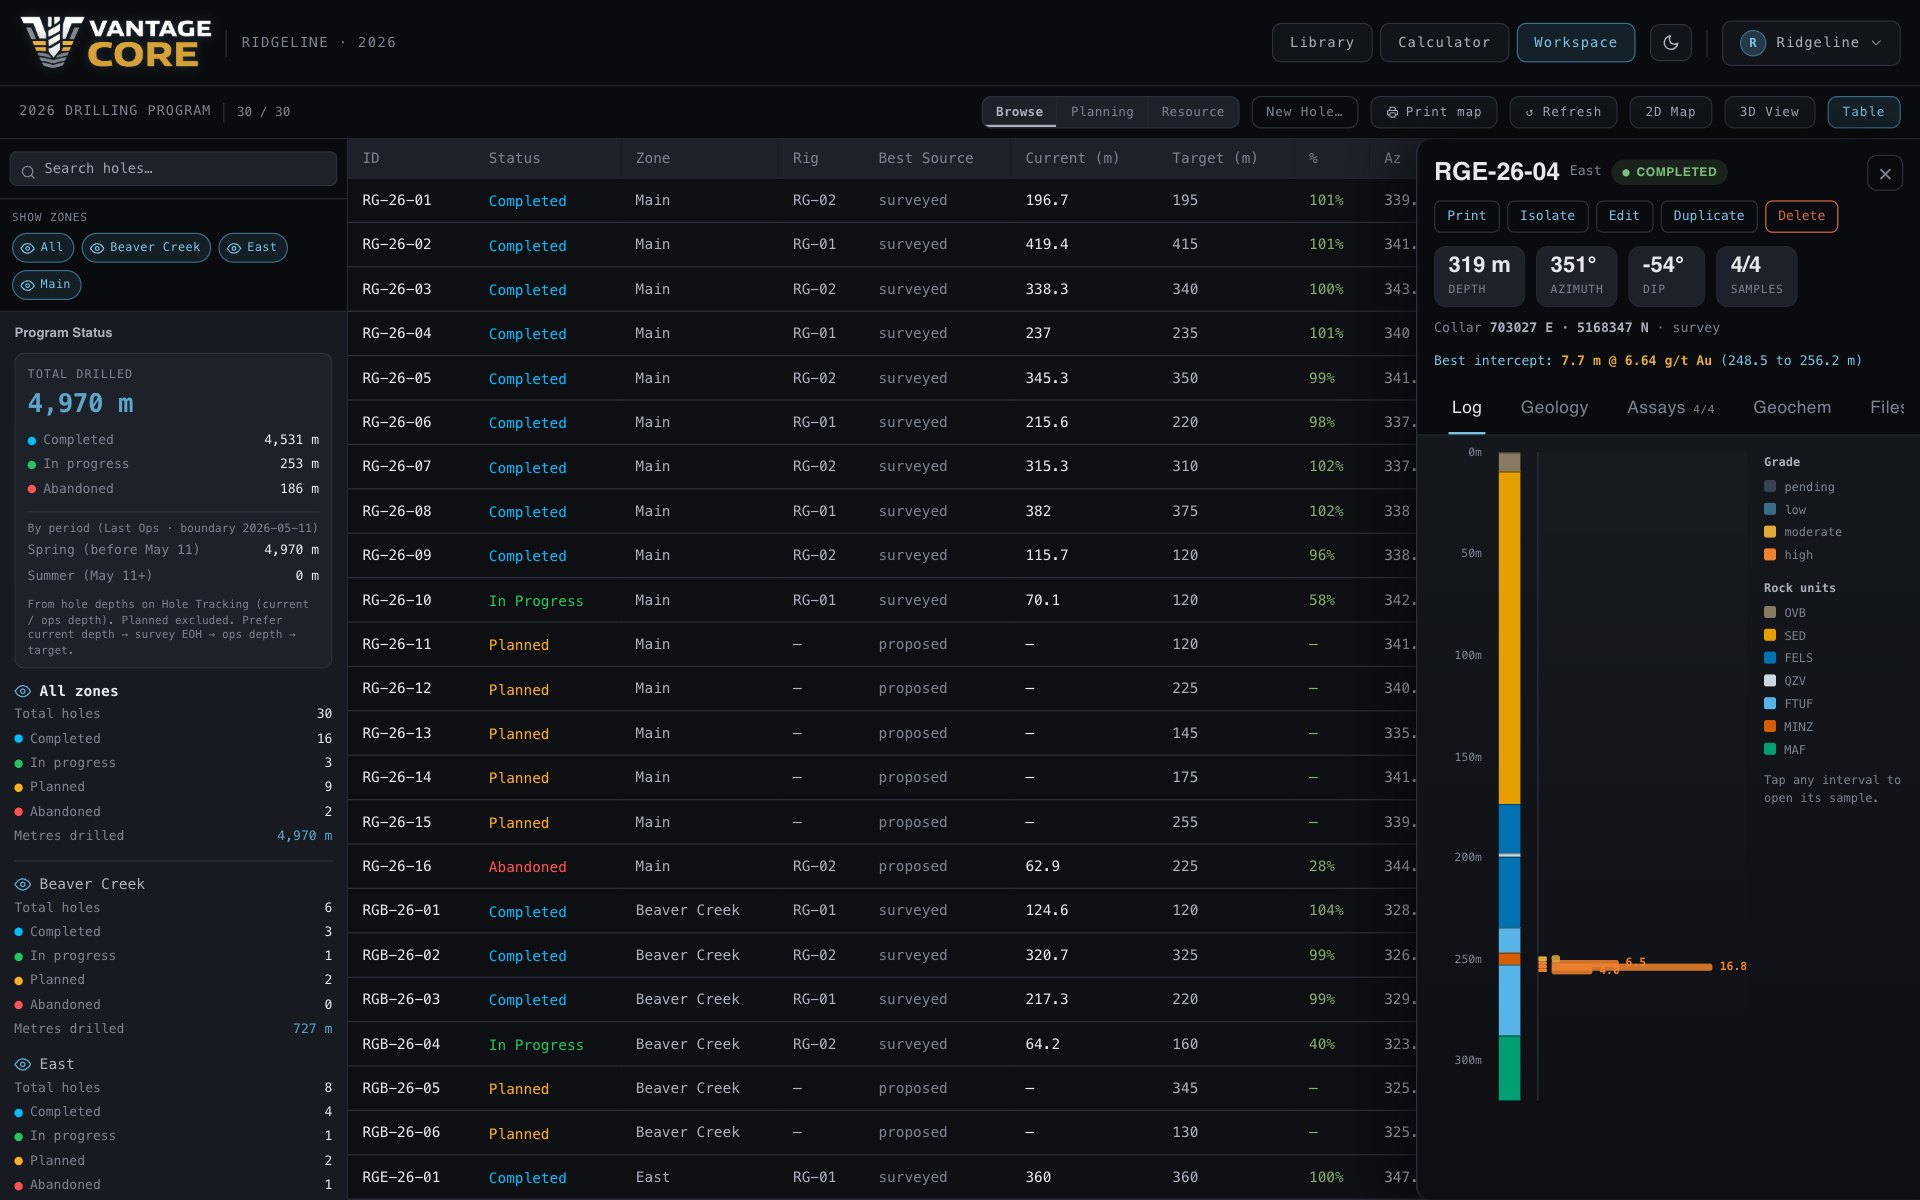
Assay intervals are drawn as coloured segments along each trace in 2D, 3D and long section, with a shared grade legend across every view. Filter by mineral or by assayed status to isolate what matters. Patterns that hide in a spreadsheet become obvious the moment they're in space.

07

Surface Sampling

Prove the target before you spend on it.

Log and map surface samples, trenches and grab results alongside the drill data in the same views. Use them as a cheap gate ahead of drill metres, and carry the evidence trail from surface anomaly through to intercept without switching tools.

Reading the ground is half of it. The other half is deciding what to drill next.

04

Planning the next hole, and showing your work

Design it against everything already in the ground, then put it in front of the people who decide.

01

Set a collar and pick a target.

02

Azimuth, dip and depth are solved for you — the draft hole draws live in 2D and 3D.

03

Sanity-check it against the surrounding holes.

04

Push it into tracking as the next planned hole.

Title block, scale bar, legend — arranged, then exported
08

Drill Planning

From target to hole in one flow.

Set a collar, pick a target, and Vantage Core works out the azimuth, dip and depth for you — with the draft hole drawn live in both 2D and 3D before you commit. Name it, sanity-check it against the surrounding holes, and push it straight into tracking as the next planned hole. Planning stops being a calculator-and-notepad exercise.

09

Print Map Designer

Boardroom output, no design software.

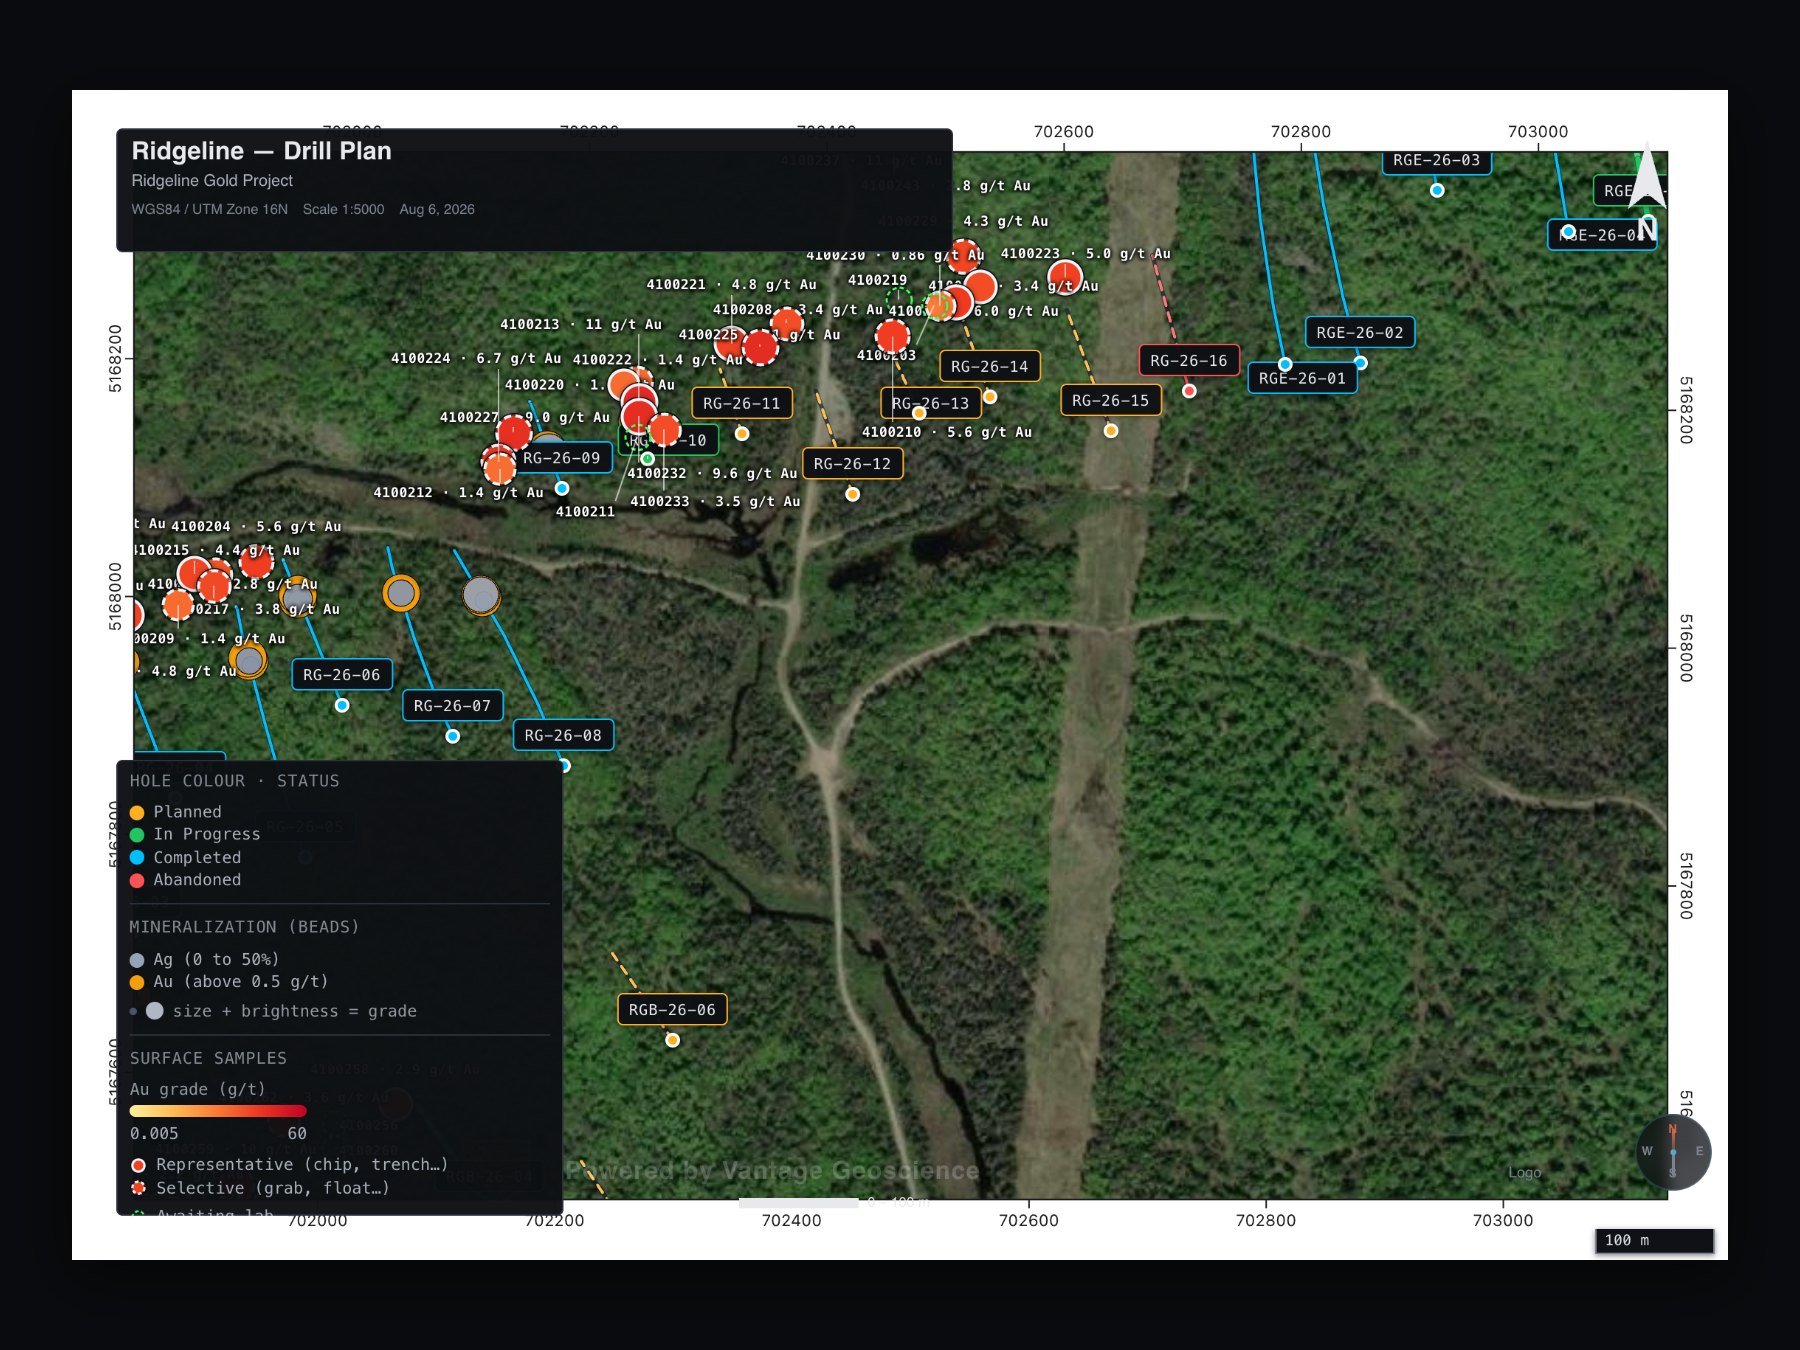
Lay out a full-page map exactly how you want it — choose your layers, holes and samples, drag the title block, scale bar and legend into place, and append data pages behind it. Export as a true PDF, not a screenshot. The report that used to eat an afternoon in Illustrator now takes a couple of minutes.

ALSO IN THE PLATFORM

The rest of it, briefly.

Resource Calculation

Domain walls, length-weighted composites, true thickness, volume, density, tonnage and contained metal — every input visible, every step reproducible, with cut-off and density scenarios side by side.

An internal calculation tool. Public resource classification still belongs to your QP.

Share & Embed

Share links or iframe embeds for a whole project or a single hole — live, interactive, viewable with no login, and revocable the moment you want them gone.

Controlled Access

Google OAuth against an approved-user list you manage. Admins write, everyone else reads, and a session log records who signed in, from where and for how long.

Data in
Excel · Google Sheets · contractor emails and reports · downhole surveys · direct integrations where supported
Overlays
GeoJSON · KML · GPX · drone orthophotos
Basemaps
Satellite · topographic · standard
Data out
Print-ready PDF map sheets · single-hole PDF reports · CSV export
Runs on
Any modern browser. Nothing to install, no per-seat licence
Setup
Configured with your team during onboarding, to your program's requirements

Every deployment is configured with your team, to your program's requirements.

Talk about your build